
Systemic Transit Map: Origin, Utility, Advantages, Applications, and Trends
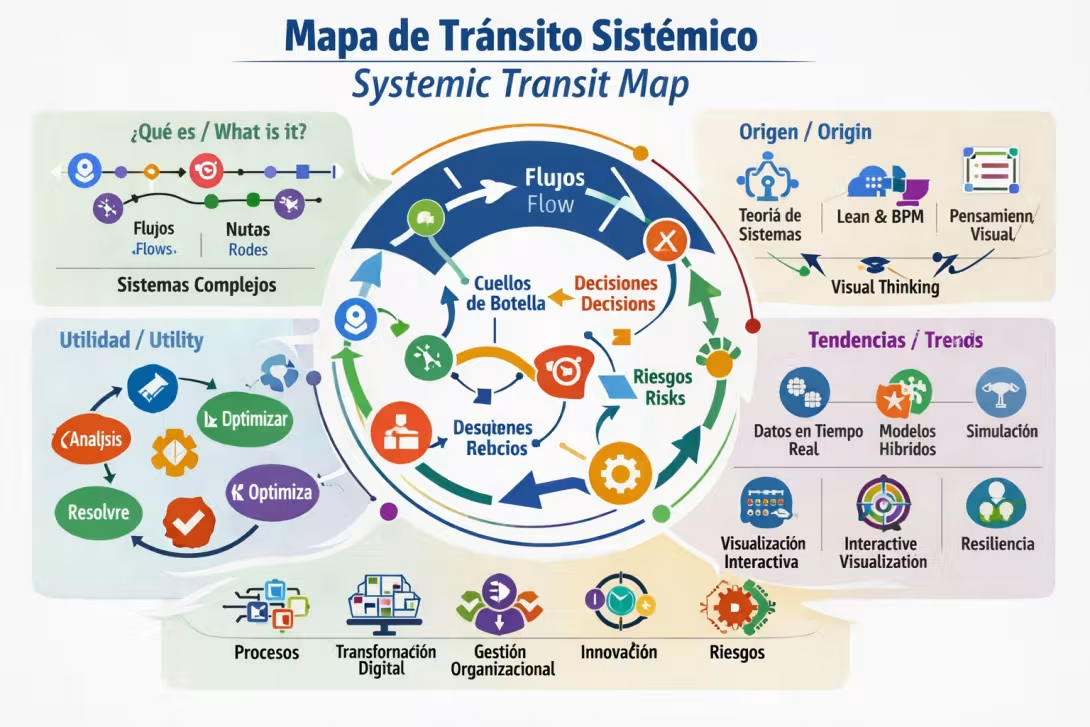
1. What is a Systemic Transit Map?
A Systemic Transit Map is a visual representation that illustrates how elements, decisions, actors, resources, or events flow through a complex system. Unlike traditional transit maps that depict physical mobility, systemic transit maps aim to make visible the internal dynamics—interdependencies, feedback loops, and emergent behaviors—within sociotechnical, organizational, or process-based systems.
Its core purpose is to transform complexity into clarity, enabling analysts and decision-makers to understand:
- How information moves
- How resources transform
- Which actors intervene
- Which decisions alter the flow
- Where bottlenecks or risks emerge
Essentially, it is a tool for systems thinking, process engineering, and complexity management.
2. Origin and Evolution
The concept of systemic transit mapping evolved from three foundational disciplines:
a) General Systems Theory (GST)
Ludwig von Bertalanffy’s work emphasized that systems should be analyzed through relationships and flows, not isolated components.
b) Process and Operations Engineering
From the 1980s onward, methodologies such as Lean, Six Sigma, and Business Process Management (BPM) adopted flow mapping to visualize processes, bottlenecks, and inefficiencies.
c) Visual Thinking and Information Design
Scholars like Edward Tufte and Don Norman advanced the use of visual representations to improve comprehension and decision-making in complex environments.
The convergence of these disciplines led to the modern Systemic Transit Map, now used across engineering, strategy, innovation, and organizational analysis.
3. Utility in Complex Systems
Systemic transit maps enable organizations to:
- Reveal hidden structures within systems
- Identify critical dependencies among processes, actors, or technologies
- Detect bottlenecks, risks, and systemic failures
- Visualize alternative routes for efficiency or resilience
- Align multidisciplinary teams through a shared visual language
- Support evidence-based strategic decisions
- Simulate scenarios to anticipate systemic effects
They serve as navigation instruments for understanding and managing complexity.
4. Key Advantages
a) Clarity in Complexity
They transform intricate systems into intuitive visual frameworks.
b) Enhanced Communication
They bridge technical, managerial, and operational perspectives.
c) Critical Insight
They expose nodes of risk, delay, or inefficiency.
d) Innovation Catalyst
They reveal alternative pathways for redesigning processes or business models.
e) Systemic Decision Support
They prevent local decisions that may cause global disruptions.
5. Fields of Application
1. Engineering and Operations
- Industrial process modeling
- Workflow optimization
- Reliability and maintenance management
2. Digital Transformation
- Data architecture mapping
- System integration
- Information flow automation
3. Organizational Management
- Structural design
- Role and responsibility mapping
- Change management
4. Innovation and Strategic Design
- Customer journey mapping
- Service blueprints
- Ecosystem visualization
5. Safety and Risk Analysis
- STPA (System-Theoretic Process Analysis)
- Causal modeling
- Vulnerability mapping
6. Differences from Other Map Types
| Map Type | Focus | Key Distinction |
|---|---|---|
| Concept Map | Logical relationships | Does not represent flows or temporal dynamics. |
| Process Map | Sequential activities | Lacks systemic interdependencies or alternative routes. |
| Value Stream Map (VSM) | Waste elimination | Operational focus, not systemic complexity. |
| Enterprise Architecture Map | Systems and technologies | Technical focus, less dynamic. |
| Systemic Transit Map | Flows, nodes, routes, alternatives | Integrates dynamics, complexity, and emergent behavior. |
7. Emerging Trends
a) Integration with Data Analytics
Maps now connect with dashboards, IoT, and real-time analytics.
b) Hybrid Modeling
Combines BPM, STPA, conceptual mapping, and service design.
c) Simulation and Digital Twins
Allows scenario testing and impact visualization before implementation.
d) Interactive Visualization
Tools like Miro, Figma, Kumu, and Graphviz enable dynamic collaboration.
e) Focus on Resilience
Used to identify alternative routes and systemic fragilities.
8. Conclusion
The Systemic Transit Map is a powerful instrument for understanding, communicating, and transforming complex systems. Its strength lies in its ability to make the invisible visible, uncover hidden dynamics, and support strategic decisions in uncertain environments. As complexity increases, these maps become essential tools for engineers, strategists, designers, and organizational leaders.
9. Bibliographic References
- Bertalanffy, L. von. General System Theory. George Braziller, 1968.
- Tufte, E. The Visual Display of Quantitative Information. Graphics Press, 2001.
- Norman, D. The Design of Everyday Things. MIT Press, 2013.
- Senge, P. The Fifth Discipline: The Art & Practice of The Learning Organization. Doubleday, 1990.
- Leveson, N. Engineering a Safer World: Systems Thinking Applied to Safety. MIT Press, 2011.
- Hammer, M., & Champy, J. Reengineering the Corporation. HarperCollins, 1993.
- Osterwalder, A., & Pigneur, Y. Business Model Generation. Wiley, 2010.
Comments