Gamma Scanning Technique as a Diagnostic Tool in Distillation Towers: Principles, Implementation, and Interpretation of Results
ABSTRACT
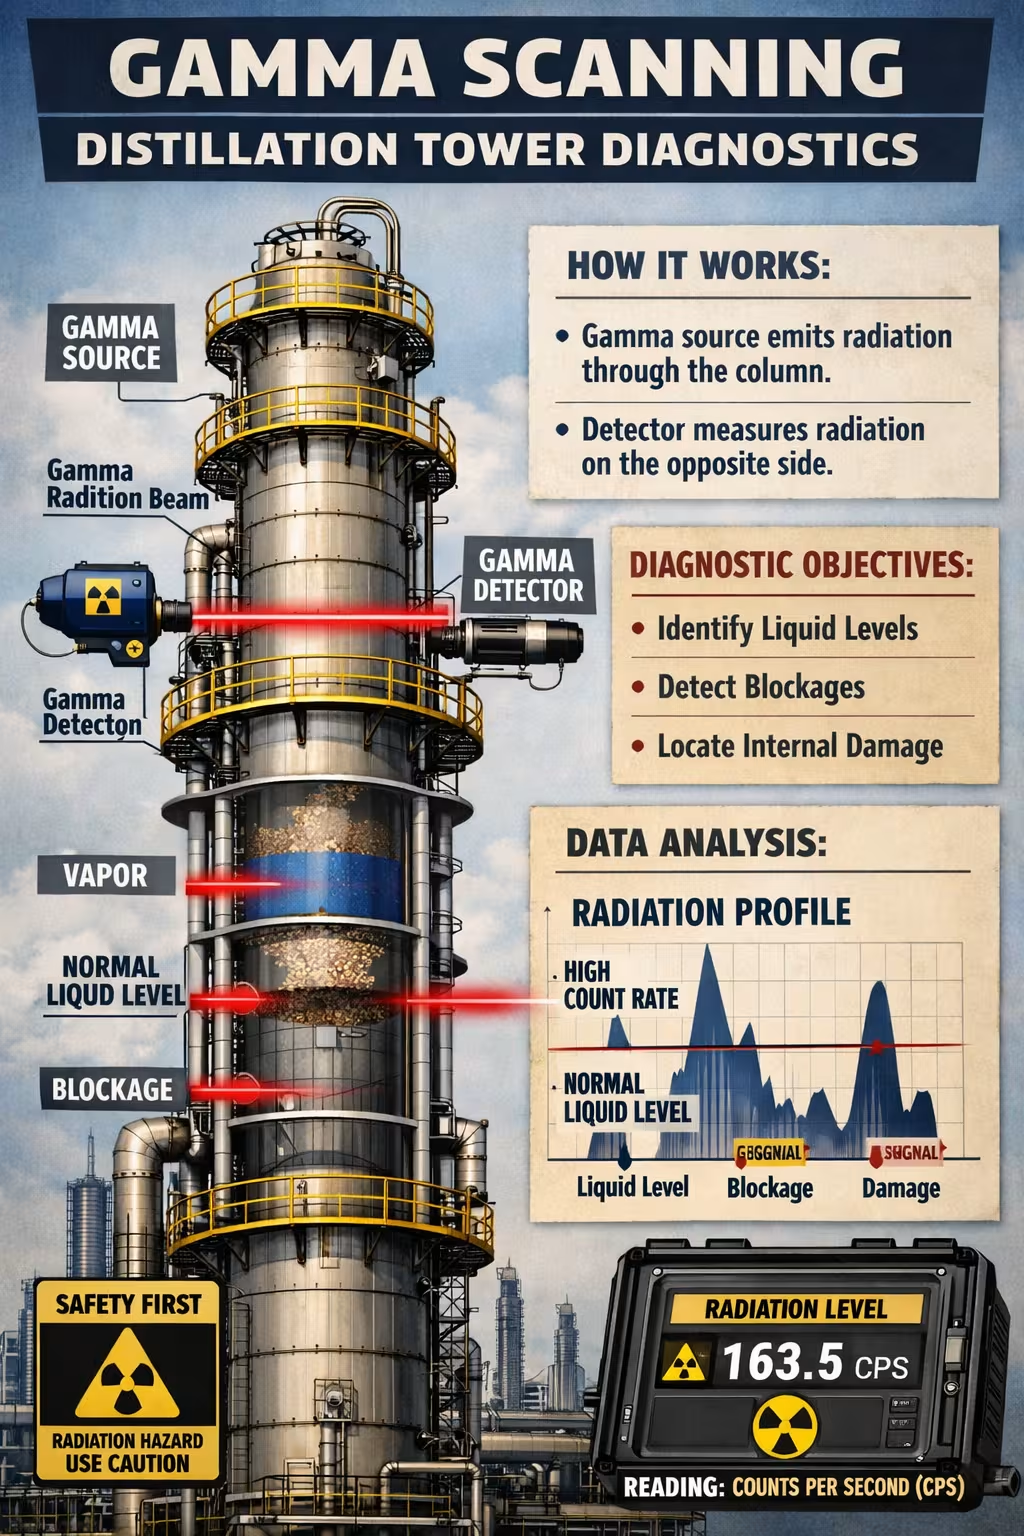
Gamma scanning, or gamma-ray profiling, is a non-destructive industrial diagnostic technique widely used in the hydrocarbon refining industry. By means of controlled gamma radiation emission through the wall of an operating distillation tower, and its synchronized detection on the opposite side, it is possible to generate a density profile that reveals the mechanical and hydraulic state of the equipment internals without shutting down the process. This article describes the physical principles of the technique, the required equipment, safety procedures and operational preparations, as well as the characteristic patterns for interpreting results in both tray columns and packed-bed columns. Typical cases such as normal operation, flooding, entrainment, foaming, weeping, mechanical damage, maldistribution, and fouling are analyzed. The technique allows diagnosing approximately 70% of a column's operational problems, making it a high-value, real-time troubleshooting tool.
Keywords: gamma scanning, radioactive profiling, distillation towers, non-invasive diagnostics, troubleshooting, petroleum refining, gamma radiation, column hydraulics.
1. Introduction
Distillation towers are among the most critical process equipment in petroleum refining complexes. The yield and quality of the products obtained depend largely on the capacity and operational efficiency of this equipment [1]. When a column exhibits any type of inefficiency, it is imperative to quickly and accurately determine what is happening inside it, since any problem can lead to significant financial losses, especially when dealing with off-specification products or hydraulic limitations that restrict production [2].
In response to this need, the petrochemical industry developed the gamma scanning technique in the mid-1950s [3], also known as radioactive profiling. This methodology makes use of the property of gamma radiation to penetrate dense metallic structures, allowing one to "visualize" the interior of an operating tower without the need to shut down the process or remove thermal insulation. The technique has been refined over time thanks to the emergence of new radiation detectors and modern data acquisition, processing, and digital storage systems [4].
According to industrial application studies, the information obtained from gamma scanning allows diagnosing and resolving approximately 70% of distillation column problems. In the remaining 30%, profiling at least allows possible causes to be ruled out, efficiently guiding corrective actions [5].
This article provides a comprehensive technical review of the methodology, covering its physical principles, equipment configuration, necessary preparations, field implementation, and criteria for interpreting the obtained profiles, both for tray columns and packed-bed columns. Representative case studies of the most common operational phenomena are included to illustrate the concepts.
2. Physical Principles of Gamma Scanning
The foundation of the technique lies in the interaction of gamma radiation with matter. Gamma photons have the ability to penetrate dense materials; however, as they pass through a structure, a fraction of the radiation is absorbed or attenuated, and this fraction is a direct function of the density and thickness of the material traversed [6]. This relationship is governed by the Beer-Lambert Law:
I = I₀ · e^(−μρx)
where I₀ is the initial intensity, μ is the mass attenuation coefficient, ρ is the material density, and x is the thickness traversed.
In practice, the radiation source is positioned on one external side of the tower and the detector on the opposite side, at the same height. Both are moved synchronously along the entire height of the equipment, generating a continuous profile of radiation intensities vs. axial position. Table 1 summarizes the relationship between the type of material present inside and the detector response:
Table 1. Material–Density–Detected Radiation Relationship
| Material | Relative Density | Radiation at Detector |
| Metal (Trays, Distributors) | High | Low |
| Liquid | Medium | Mid-range |
| Foam (Liquid/Vapor) | Medium-Low | Medium-High |
| Vapor | Low | High |
When radiation travels across the tower diameter without encountering obstacles (free vapor space), the detector registers high intensity values (low attenuation). Conversely, when encountering structural materials such as trays or distributors (high metallic density), the signal drops significantly. Liquids produce intermediate attenuations that allow the liquid holdup to be determined and distinguish between liquid, foamy, and vapor phases [7].
3. Gamma Scanning Equipment Configuration
The gamma scanning system is inherently portable and can be transported by a two-person team. Its main components are [8]:
- Gamma ray source: Cobalt-60 (Co-60) or Cesium-137 (Cs-137) are typically used, selected for their photon energy, half-life, and industrial availability. Both isotopes are encapsulated and stored in a shielded container (transport drum) that complies with international regulations for radioactive material transport.
- Radiation detector: A device sensitive to emitted gamma rays, connected to a data acquisition system. Modern detectors are scintillation-type (NaI(Tl)) or semiconductor-based, with high efficiency and energy resolution.
- Computer data acquisition and analysis system: A portable computer with specialized software for real-time recording, visualization, and processing of the obtained density profiles.
- Ropes and positioning systems: Used to guide the source and detector from the tower's upper platform, ensuring alignment and the intended trajectory along the equipment's full height.
Upon completion of the gamma scan, all equipment is returned to its transport cases. A preliminary field report is generated for the client, and the final technical report is delivered in PDF format and in print within the agreed timeframe [9].
4. Preparations for Conducting Gamma Scanning
4.1 Technical Preparations
To execute the profiling, the following engineering information is required [10]:
- Tower drawings specifying total height, diameter, wall thickness, and tray elevation grades.
- Downcomer orientation in tray columns.
- For packed-bed columns: bed and distributor elevations, packing type, and bed density.
- Operational problem history and specific profiling objectives.
4.2 Operational Preparations
Gamma scanning is generally performed without prior preparation of the distillation tower. Typically, no adjustments to operating conditions are required, thermal insulation removal is not necessary, and the analysis does not interfere with continuous process operation [11]. Only the following are needed:
- Access to the tower's upper platform.
- A safe work permit and cordoning off of the influence area.
- In some cases, opening windows in intermediate platforms for rope passage.
The technique is applicable to towers ranging from 0.15 m (6 inches) to 10 m in diameter, making it versatile for the full range of equipment found in a refinery.
4.3 Radiological Safety Preparations
Gamma scanning operations are regulated by national and international radiological safety standards. Sources are handled under strict safety conditions by qualified and certified personnel, complying with all requirements of the operating company's safety standards (e.g., safety guides) and applicable COVENIN standards [12]. The emitted radiation produces no effect on the tower's structural materials, control systems, or process products.
4.4 Logistical Preparations
Critical logistical aspects include [13]:
- Processing industrial passes for personnel and equipment (computer, detector, and drum with the radioactive source).
- Completing induction courses required by the facility (H₂S, hazard notification, among others).
- Prior notification to local operations, maintenance, reliability, any relevant committee, and industrial hygiene and safety personnel.
5. Implementation of the Technique
Interpretation of a density profile requires a combination of theoretical mastery and field experience. The diversity of phenomena involved—both internal mechanical components and process variables—complicates the profile and demands a thorough knowledge of the analyzed equipment [14].
The profiling result is presented by plotting the tower height on the vertical axis (Y) and the radiation intensity or relative density on the horizontal axis (X), on an inverse logarithmic scale (greater density toward the left). The data are analyzed to evaluate liquid holdup and the quality of liquid-vapor separation at each tray or packed-bed section [15].
In tray columns, profiling is performed through the tray bubble area, avoiding downcomers. Reference gamma scans, obtained with the tower under normal conditions when first placed in service, form the baseline for future comparisons in troubleshooting.
In packed-bed columns, the analysis can be performed with a single linear pass or through a 2×2 scan grid, which allows evaluating the lateral phase distribution and detecting maldistribution or localized fouling problems.
6. Case Studies and Interpretation of Results
6.1 Tray Columns
6.1.1 Normal Operation (Reference Case)
Under normal conditions, the profile shows a regular alternation between high-density zones (trays with liquid level) and low-density zones (vapor spaces between trays). The vapor bar—the zone of minimum density—is positioned to the right of the diagram and the liquid level line to its left. The normal liquid level on the tray is consistent with the weir height. Any deviation from this pattern indicates the presence of an operational problem [16].
6.1.2 Flooding
Flooding manifests in the profile as an extended zone of low radiation (high density) spanning several consecutive trays, indicating liquid accumulation. In severe cases, the accumulated liquid exhibits greater density than the normal level on the tray (which contains bubbles), which can be attributed to solid accumulation on lower trays or flow conditions exceeding the equipment's hydraulic capacity [17]. It should be noted that potential tray damage in flooded zones is not easily detectable by this technique.
6.1.3 Entrainment
Entrainment occurs when the upward vapor flow velocity is sufficient to lift liquid droplets to the upper tray, reducing separation efficiency. In the gamma scanning profile, this phenomenon is evidenced by a displacement of the high-radiation point to the left of the vapor bar, indicating the presence of liquid in the zone that should be occupied by vapor. Characteristically, entrainment generates a sharp peak in the curve; the continuous signal allows flooding to be ruled out as a cause [18].
6.1.4 Foaming
Foam formation is a common problem in many distillation services and results from emulsification of liquid and vapor. The gamma scan shows one or more sharp peaks above the normal liquid level on the tray, with an absence of a clear vapor space between consecutive trays [19]. Comparing profiles before and after injection of antifoam agents allows quantifying the effectiveness of the treatment and confirming the diagnosis.
6.1.5 Weeping
Weeping occurs when the vapor flow is insufficient to sustain the liquid level on the tray, generating a liquid rain that falls from tray to tray. As with entrainment, the profile shows a curve deviating from the vapor bar; however, unlike entrainment, weeping produces a flatter and more extended curve in the separation zone. The severity of the phenomenon can be estimated based on the percentage of separation from the vapor bar [20].
6.1.6 Mechanical Damage
One of the most valuable applications of gamma scanning is verifying the mechanical integrity of internals. If a tray is absent or damaged and unable to sustain the liquid-foam level, the profile will show high radiation (low density) at the axial position where the tray should be registered, indicating the absence of metallic mass. This information is critical for planning plant shutdowns and prioritizing internal replacements [21].
6.2 Packed-Bed Columns
6.2.1 Normal Operation (Reference Case)
Under normal conditions, a good distribution of liquid and vapor in the packed section generates a uniform density pattern in which the four grid scan lines overlap each other. The degree of overlap constitutes a relative measure of distribution quality. Distributors, demisters, and chimney trays should appear at their design elevations [22].
6.2.2 Maldistribution
Maldistribution can be caused by distributor fouling, inadequate design, or mechanical deterioration of the distributor. In the grid profile, it manifests as dispersion among the four scan lines, reflecting density differences at different radial positions of the bed. Liquids are associated with low radiation intensity (left side) and vapor with high intensity (right side) [23].
6.2.3 Damaged or Missing Packing
Gamma scanning can reveal whether bed material has been damaged, compacted, or displaced. A zone of high radiation (low density) at the top of the bed is indicative of collapsed or missing packing. This information allows the plant to estimate the quantity of replacement material required for the next maintenance shutdown [24].
6.2.4 Fouling
Packed beds are especially susceptible to fouling given their high contact surface area, which is particularly problematic in vacuum distillation [25]. Fouling is revealed in the profile as a flooded section of the bed with abnormally high densities. Comparing profiles taken before and after an operational cycle allows quantifying the evolution of fouling and planning cleaning interventions.
7. Scope of Service and Industrial Benefits
The complete gamma scanning service comprises the following stages [9,26]:
- Planning the profiling based on diagnostic objectives and equipment configuration.
- Execution of field gamma-ray profiling.
- Real-time data recording, processing, and graphing.
- Interpretation of graphs together with local process engineers.
- Preparation of a written technical report with findings and recommendations.
Beyond its role in troubleshooting, gamma scanning is a high-value preventive tool. Conducting periodic reference profiles allows detecting deterioration trends before they materialize into operational failures, facilitating plant shutdown optimization and internal replacement planning [27]. The technique does not interfere with production, does not require the removal of thermal insulation, and can be applied to towers ranging from 0.15 to 10 meters in diameter.
8. Conclusions
Gamma scanning has established itself as one of the most effective non-destructive diagnostic tools for the real-time evaluation of distillation towers in the refining industry. Its main advantages are the absence of process shutdown, versatility of application, and the richness of information obtained, both in terms of mechanical integrity and hydraulic behavior.
Correct interpretation of density profiles requires field experience and a thorough knowledge of the evaluated equipment. The characteristic patterns of phenomena such as flooding, entrainment, foaming, weeping, and mechanical damage enable rapid and reliable diagnosis, guiding corrective actions with precision.
In packed-bed columns, the grid exploration adds a spatial dimension to the diagnosis, allowing identification of maldistribution and localized fouling that a single linear profile might not reveal.
Incorporating gamma scanning as a regular practice within the integrity and reliability programs of refining complexes represents a high-return investment, capable of preventing unplanned shutdowns and optimizing maintenance cycles.
References
[1] Kister, H. Z. (1992). Distillation Design. McGraw-Hill, New York. ISBN 978-0070349094.
[2] Fair, J. R., Steinmeyer, D. E., Penney, W. R., & Crocker, B. B. (1997). Gas absorption and gas-liquid system design. In Perry's Chemical Engineers' Handbook, 7th ed. McGraw-Hill.
[3] Ficke, H. H. (1959). Gamma-ray profiling of distillation towers. Chemical Engineering Progress, 55(3), 45–49.
[4] Hesketh, H. E., & Cross, F. L. (1989). Gamma scanning in chemical process industries: A review. Journal of Hazardous Materials, 21(2), 101–118.
[5] Kister, H. Z., & Haas, J. R. (1988). Predict entrainment flooding on sieve and valve trays. Chemical Engineering Progress, 84(9), 63–69.
[6] Attix, F. H. (2004). Introduction to Radiological Physics and Radiation Dosimetry. Wiley-VCH, Weinheim. ISBN 978-0471011460.
[7] Trambouze, P., & Euzen, J. P. (2004). Chemical Reactors: From Design to Operation. Technip, Paris. ISBN 978-2710808787.
[8] Pilling, M., & Holden, B. (2009). Gamma scanning and neutron backscatter: Practical guide for process column diagnostics. Sulzer Chemtech Technical Report TR-109.
[9] Córdova Group, Inc. (2008). Gamma Scanning Service Capabilities and Procedures. Technical Documentation. Houston, Texas.
[10] Seider, W. D., Seader, J. D., & Lewin, D. R. (2004). Product and Process Design Principles. John Wiley & Sons. ISBN 978-0471216636.
[11] Summers, D. R. (1995). Non-invasive column diagnostics. Chemical Engineering, 102(7), 92–97.
[12] PDVSA (2003). Safety Guide for Work with Ionizing Radiation (CAPRA). Industrial Safety Division, Caracas.
[13] COVENIN 2248:1995. Handling of Radioactive Materials — Safety Requirements. FONDONORMA, Venezuela.
[14] Kister, H. Z. (2006). Distillation Troubleshooting. John Wiley & Sons. ISBN 978-0471467335.
[15] Lieberman, N. P., & Lieberman, E. T. (2008). Working Guide to Process Equipment, 3rd ed. McGraw-Hill.
[16] Lockett, M. J. (1986). Distillation Tray Fundamentals. Cambridge University Press. ISBN 978-0521311335.
[17] Lygeros, A. I., & Magoulas, K. G. (1986). Column flooding and entrainment. Chemical Engineering, 93(8), 97–106.
[18] Stichlmair, J. G., & Fair, J. R. (1998). Distillation: Principles and Practice. Wiley-VCH. ISBN 978-0471252412.
[19] Darton, R. C., La Nauze, R. D., Davidson, J. F., & Harrison, D. (1977). Bubble growth due to coalescence in fluidised beds. Trans. Inst. Chem. Eng., 55, 274–280.
[20] Treybal, R. E. (1980). Mass Transfer Operations, 3rd ed. McGraw-Hill. ISBN 978-0070651760.
[21] Henry, Z. K. (2002). Mechanical integrity assessment of distillation internals using gamma scanning. Proceedings of the AIChE Annual Meeting, Indianapolis.
[22] Billet, R. (1995). Packed Towers in Processing and Environmental Technology. VCH Publishers. ISBN 978-3527286034.
[23] Strigle, R. F. (1994). Packed Tower Design and Applications, 2nd ed. Gulf Publishing. ISBN 978-0884152101.
[24] Górak, A., & Sorensen, E. (Eds.) (2014). Distillation: Fundamentals and Principles. Academic Press. ISBN 978-0123868763.
[25] Meili, A. (1992). Heat pumps for distillation columns. Chemical Engineering Progress, 88(6), 60–65.
[26] Olujic, Z., Seibert, A. F., & Fair, J. R. (2000). Influence of corrugation geometry on the performance of structured packings: An experimental study. Chemical Engineering & Processing, 39(4), 335–342.
[27] Humphrey, J. L., & Keller, G. E. (1997). Separation Process Technology. McGraw-Hill. ISBN 978-0070311923.
Comentarios